The dashboard
Sign in, and the day explains itself.
The landing screen is the morning briefing: today's shifts with per-status counts, unfilled shifts over the next 7 days, pending offers, open alerts, documents due for renewal, and the active census. Every card links straight into its module, so seeing a problem and acting on it are one click apart.
- Each section appears only for users holding the matching permission: a biller's dashboard and a scheduler's dashboard are genuinely different.
- Charts show the shape of the agency: clients by service type, this month's shifts by status, a 14-day filled-versus-unfilled workload, and care hours delivered over the last 8 weeks, drawn from verified actuals.
- Caregivers and families get their own summary strips, each scoped to its own world.
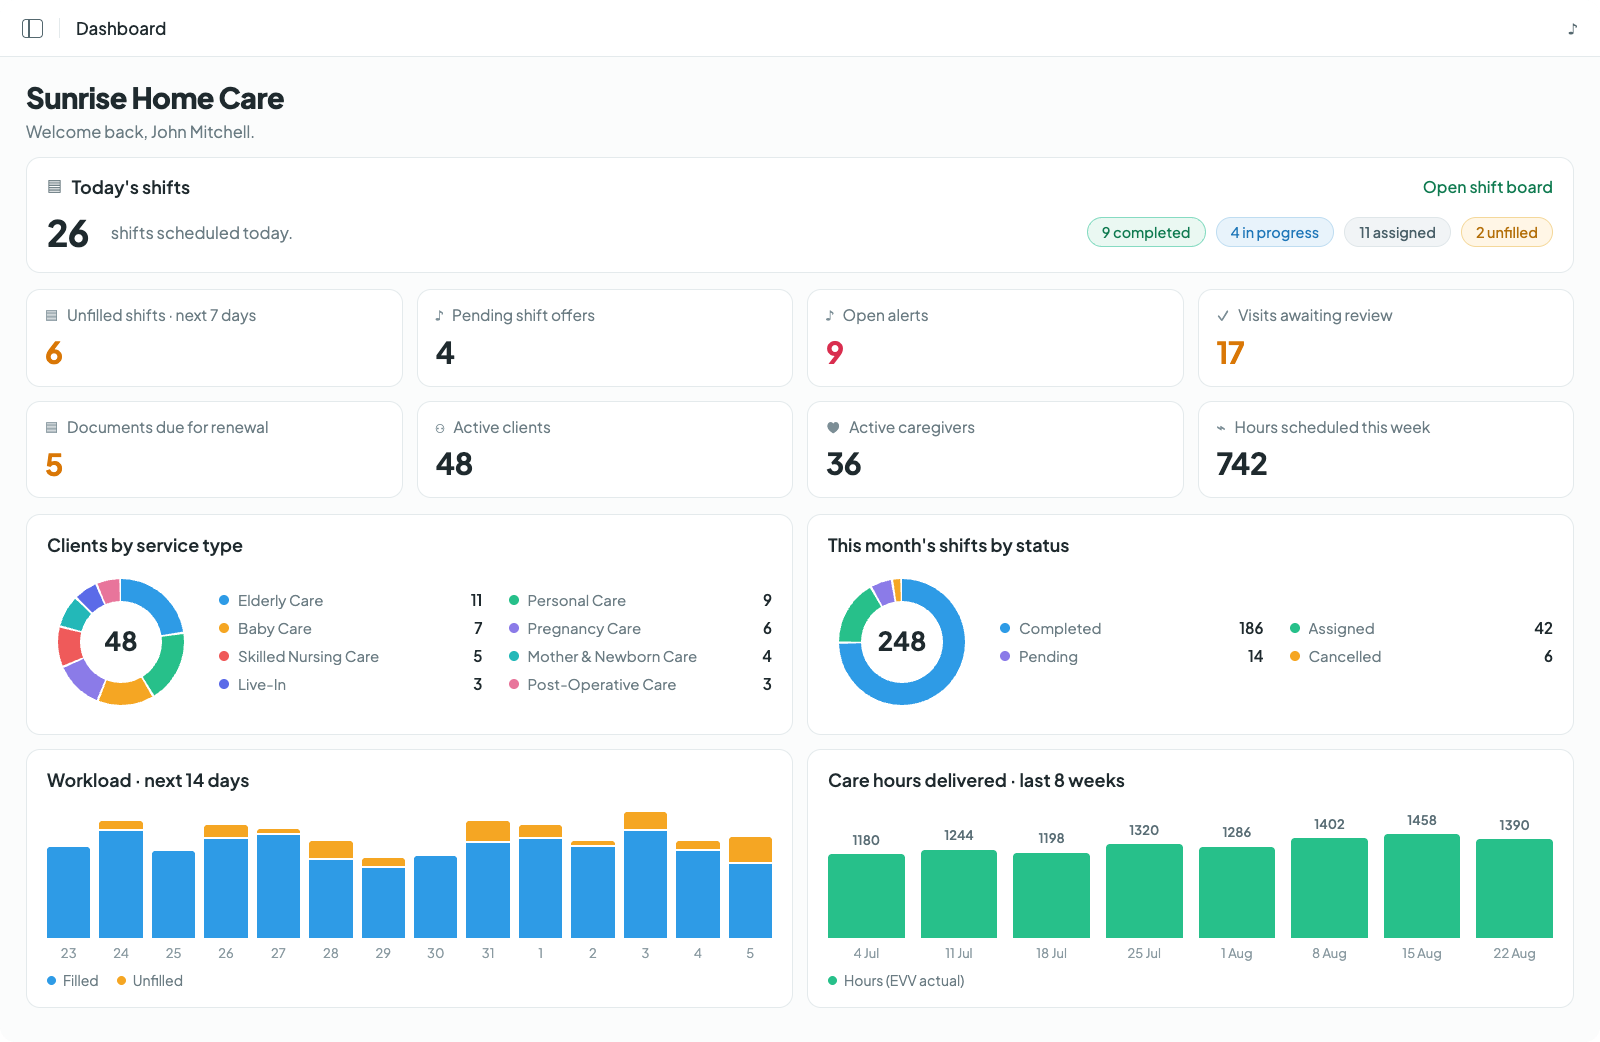
The morning briefing: counts that link to their lists, charts drawn from verified work. Click to enlarge.
The reports
Built for the questions agencies actually get asked.
Every report filters by client, caregiver, office, or status, always over a bounded date range, and downloads as CSV or a styled Excel workbook.
Shift register
Every shift in a range with scheduled versus actual hours, clock times in the agency's timezone, and the overnight marker. The "what happened this month" report.
Caregiver hours
Per-caregiver totals: shifts, scheduled versus verified hours, completed and missed counts. The plan-versus-actual timesheet behind every payroll check.
Missing punches
Past shifts with broken proof: never clocked in, or in but never out, each flagged with its issue. The cleanup list before billing runs.
Billing variance
Per-client scheduled versus actual versus invoiced, in hours and dollars, with the short and over deltas. Where quiet revenue leaks become visible.
Compliance expiry
Everything expiring in the window across caregivers and clients, with days left and already-expired flags. The inspection-readiness list.
Daily summary
One row per day: scheduled, completed, missed, and cancelled shifts, hours delivered, and incidents. The quarter at a glance, one line at a time.
Out the door
Exports that arrive presentable.
CSV everywhere, and the registers that matter, the shift register, the caregiver timesheet, and the payroll period detail, also download as styled Excel workbooks: agency letterhead, frozen headers, per-caregiver subtotals, and color-coded exception rows. The payroll page shows one as it opens.
Common reporting questions.
Today's shifts with per-status counts, unfilled shifts over the next 7 days, pending offers, open alerts, documents due for renewal, and the active client and caregiver census. Every card links into its module, and each section appears only for users holding the matching permission.
Shift register, caregiver hours, missing punches, billing variance, compliance expiry, and a daily summary. Every report requires a date range so exports stay bounded, and everything filters before it downloads.
Yes, twice over: CSV everywhere, and the shift register, caregiver timesheet, and payroll period detail also download as styled Excel workbooks with the agency letterhead, frozen headers, subtotals, and color-coded exception rows.
Yes. Caregivers see this month's shifts, completed visits, hours worked, and what is coming up; families see visits completed, hours of care, and upcoming visits. Each audience gets its own summary, scoped to its own world.
Start tomorrow with the day already explained.
Start your 30-day free trialNo credit card to start · Cancel anytime